笔记
单击此处 下载完整的示例代码
放置颜色条#
颜色条表示图像数据的定量范围。放置在图形中并非易事,因为需要为它们腾出空间。
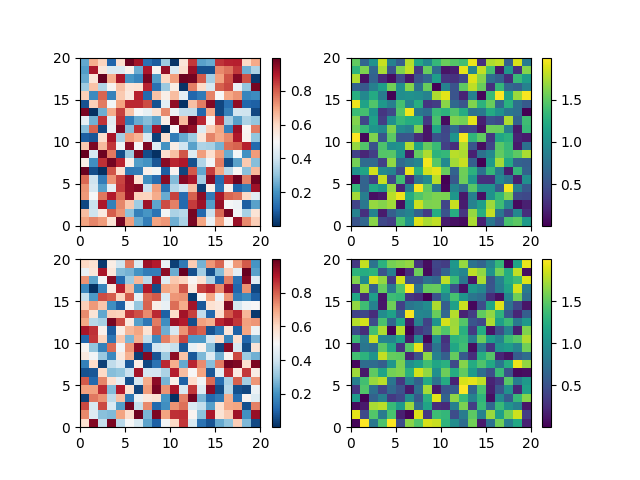
最简单的情况是在每个轴上附加一个颜色条:
import matplotlib.pyplot as plt
import numpy as np


# Fixing random state for reproducibility
np.random.seed(19680801)

fig, axs = plt.subplots(2, 2)
cmaps = ['RdBu_r', 'viridis']
for col in range(2):
    for row in range(2):
        ax = axs[row, col]
        pcm = ax.pcolormesh(np.random.random((20, 20)) * (col + 1),
                            cmap=cmaps[col])
        fig.colorbar(pcm, ax=ax)
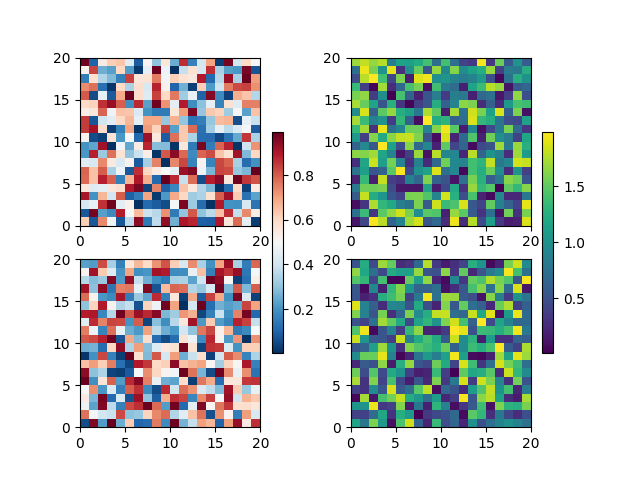
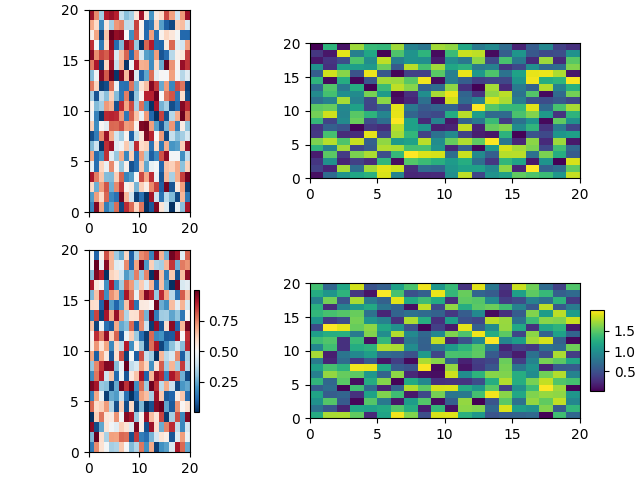
第一列在两行中都有相同类型的数据,因此可能需要将我们通过调用的颜色
Figure.colorbar条与轴列表而不是单个轴组合起来。
fig, axs = plt.subplots(2, 2)
cmaps = ['RdBu_r', 'viridis']
for col in range(2):
    for row in range(2):
        ax = axs[row, col]
        pcm = ax.pcolormesh(np.random.random((20, 20)) * (col + 1),
                            cmap=cmaps[col])
    fig.colorbar(pcm, ax=axs[:, col], shrink=0.6)
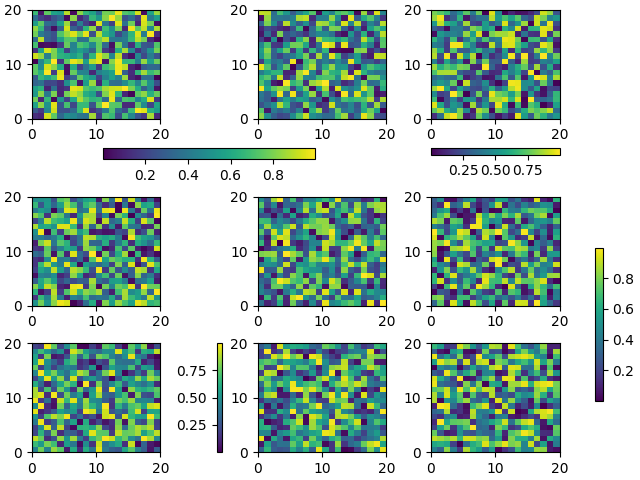
使用这种范例可以实现相对复杂的颜色条布局。请注意,此示例的效果要好得多
constrained_layout=True
fig, axs = plt.subplots(3, 3, constrained_layout=True)
for ax in axs.flat:
    pcm = ax.pcolormesh(np.random.random((20, 20)))

fig.colorbar(pcm, ax=axs[0, :2], shrink=0.6, location='bottom')
fig.colorbar(pcm, ax=[axs[0, 2]], location='bottom')
fig.colorbar(pcm, ax=axs[1:, :], location='right', shrink=0.6)
fig.colorbar(pcm, ax=[axs[2, 1]], location='left')
<matplotlib.colorbar.Colorbar object at 0x7f2cfb43f070>
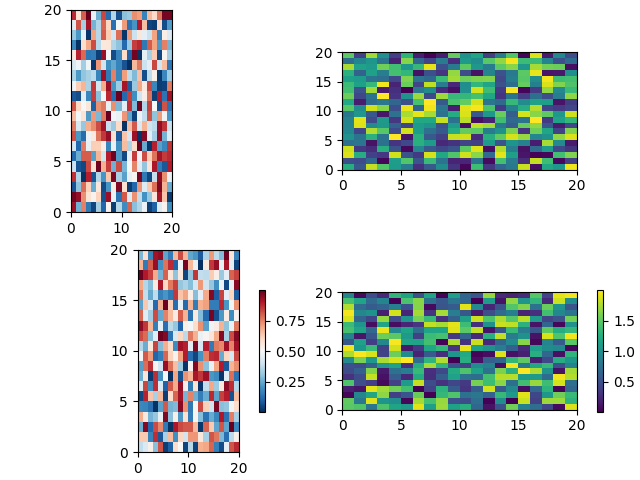
具有固定纵横比轴的颜色条#
为具有固定纵横比的轴放置颜色条会带来特殊的挑战,因为父轴会根据数据视图改变大小。
fig, axs = plt.subplots(2, 2,  constrained_layout=True)
cmaps = ['RdBu_r', 'viridis']
for col in range(2):
    for row in range(2):
        ax = axs[row, col]
        pcm = ax.pcolormesh(np.random.random((20, 20)) * (col + 1),
                            cmap=cmaps[col])
        if col == 0:
            ax.set_aspect(2)
        else:
            ax.set_aspect(1/2)
        if row == 1:
            fig.colorbar(pcm, ax=ax, shrink=0.6)
解决此问题的一种方法是使用 anAxes.inset_axes在轴坐标中定位轴。请注意,如果您放大轴并更改轴的形状,颜色栏也会改变位置。
fig, axs = plt.subplots(2, 2, constrained_layout=True)
cmaps = ['RdBu_r', 'viridis']
for col in range(2):
    for row in range(2):
        ax = axs[row, col]
        pcm = ax.pcolormesh(np.random.random((20, 20)) * (col + 1),
                            cmap=cmaps[col])
        if col == 0:
            ax.set_aspect(2)
        else:
            ax.set_aspect(1/2)
        if row == 1:
            cax = ax.inset_axes([1.04, 0.2, 0.05, 0.6])
            fig.colorbar(pcm, ax=ax, cax=cax)

plt.show()
脚本总运行时间:(0分4.244秒)