笔记
单击此处 下载完整的示例代码
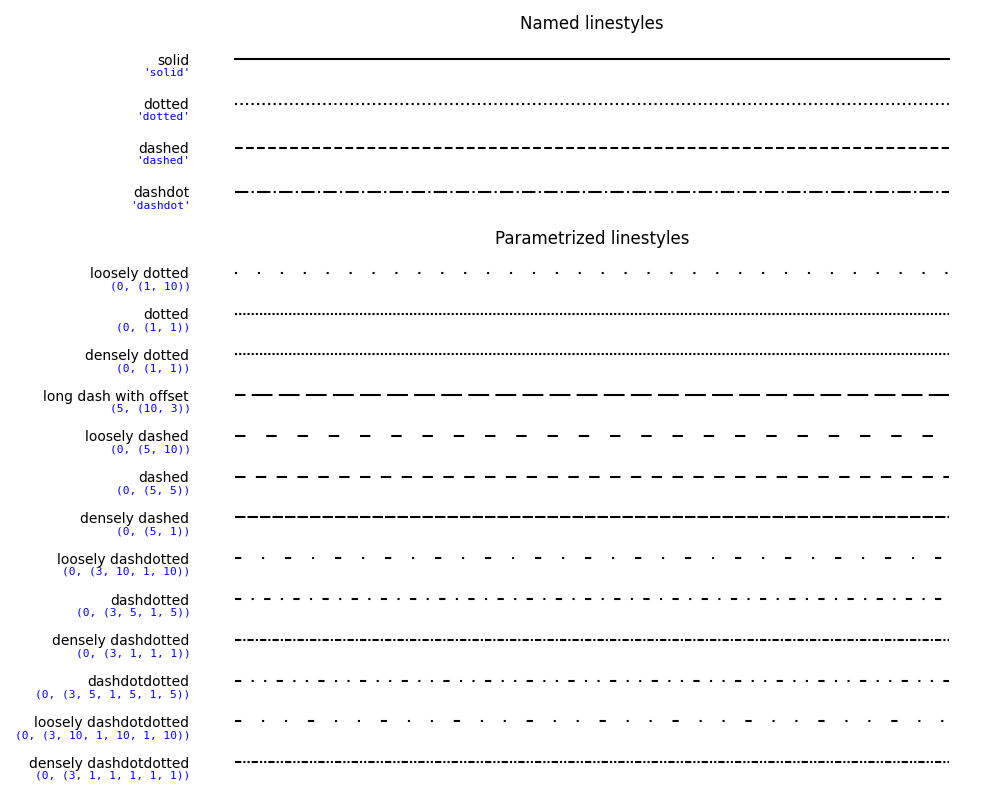
线型#
可以使用字符串“solid”、“dotted”、“dashed”或“dashdot”来定义简单的线型。通过提供破折号元组可以实现更精细的控制
。例如,表示 (3pt line, 10pt space, 1pt line, 15pt space) 没有偏移,而
, 表示 (10pt line, 3pt space),但跳过第一个 5pt 行。另请参阅。(offset, (on_off_seq))(0, (3, 10, 1, 15))(5, (10, 3))Line2D.set_linestyle
注意:也可以通过自定义虚线样式Line2D.set_dashes
中所示的方式配置虚线样式,并使用关键字dashes将
虚线序列列表传递给property_cycle中的循环器。
import numpy as np
import matplotlib.pyplot as plt

linestyle_str = [
     ('solid', 'solid'),      # Same as (0, ()) or '-'
     ('dotted', 'dotted'),    # Same as (0, (1, 1)) or ':'
     ('dashed', 'dashed'),    # Same as '--'
     ('dashdot', 'dashdot')]  # Same as '-.'

linestyle_tuple = [
     ('loosely dotted',        (0, (1, 10))),
     ('dotted',                (0, (1, 1))),
     ('densely dotted',        (0, (1, 1))),
     ('long dash with offset', (5, (10, 3))),
     ('loosely dashed',        (0, (5, 10))),
     ('dashed',                (0, (5, 5))),
     ('densely dashed',        (0, (5, 1))),

     ('loosely dashdotted',    (0, (3, 10, 1, 10))),
     ('dashdotted',            (0, (3, 5, 1, 5))),
     ('densely dashdotted',    (0, (3, 1, 1, 1))),

     ('dashdotdotted',         (0, (3, 5, 1, 5, 1, 5))),
     ('loosely dashdotdotted', (0, (3, 10, 1, 10, 1, 10))),
     ('densely dashdotdotted', (0, (3, 1, 1, 1, 1, 1)))]


def plot_linestyles(ax, linestyles, title):
    X, Y = np.linspace(0, 100, 10), np.zeros(10)
    yticklabels = []

    for i, (name, linestyle) in enumerate(linestyles):
        ax.plot(X, Y+i, linestyle=linestyle, linewidth=1.5, color='black')
        yticklabels.append(name)

    ax.set_title(title)
    ax.set(ylim=(-0.5, len(linestyles)-0.5),
           yticks=np.arange(len(linestyles)),
           yticklabels=yticklabels)
    ax.tick_params(left=False, bottom=False, labelbottom=False)
    ax.spines[:].set_visible(False)

    # For each line style, add a text annotation with a small offset from
    # the reference point (0 in Axes coords, y tick value in Data coords).
    for i, (name, linestyle) in enumerate(linestyles):
        ax.annotate(repr(linestyle),
                    xy=(0.0, i), xycoords=ax.get_yaxis_transform(),
                    xytext=(-6, -12), textcoords='offset points',
                    color="blue", fontsize=8, ha="right", family="monospace")


fig, (ax0, ax1) = plt.subplots(2, 1, figsize=(10, 8), height_ratios=[1, 3])

plot_linestyles(ax0, linestyle_str[::-1], title='Named linestyles')
plot_linestyles(ax1, linestyle_tuple[::-1], title='Parametrized linestyles')

plt.tight_layout()
plt.show()