笔记
单击此处 下载完整的示例代码
自定义颜色条教程#
本教程展示了如何构建和自定义独立的颜色条,即没有附加图。
自定义颜色条#
Acolorbar需要一个“可映射”( matplotlib.cm.ScalarMappable) 对象(通常是图像),它指示要使用的颜色图和规范。为了创建没有附加图像的颜色条,可以使用ScalarMappable没有关联数据的 a。
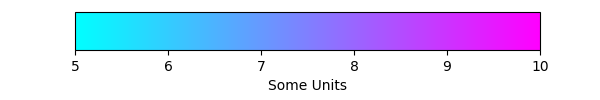
基本连续彩条#
在这里,我们创建了一个带有刻度和标签的基本连续颜色条。
colorbar调用的参数是ScalarMappable
(使用norm和cmap参数构造)、应该绘制颜色条的轴以及颜色条的方向。
有关更多信息,请参阅colorbarAPI。
import matplotlib.pyplot as plt
import matplotlib as mpl

fig, ax = plt.subplots(figsize=(6, 1))
fig.subplots_adjust(bottom=0.5)

cmap = mpl.cm.cool
norm = mpl.colors.Normalize(vmin=5, vmax=10)

fig.colorbar(mpl.cm.ScalarMappable(norm=norm, cmap=cmap),
             cax=ax, orientation='horizontal', label='Some Units')
<matplotlib.colorbar.Colorbar object at 0x7f2cdf4e94e0>
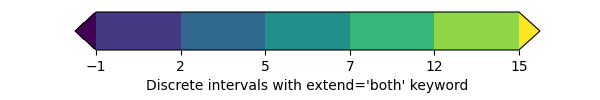
具有连续色阶的扩展颜色条#
第二个示例展示了如何基于连续 cmap 制作离散颜色条。使用“扩展”关键字参数选择适当的颜色来填充颜色空间,包括扩展:
fig, ax = plt.subplots(figsize=(6, 1))
fig.subplots_adjust(bottom=0.5)

cmap = mpl.cm.viridis
bounds = [-1, 2, 5, 7, 12, 15]
norm = mpl.colors.BoundaryNorm(bounds, cmap.N, extend='both')

fig.colorbar(mpl.cm.ScalarMappable(norm=norm, cmap=cmap),
             cax=ax, orientation='horizontal',
             label="Discrete intervals with extend='both' keyword")
<matplotlib.colorbar.Colorbar object at 0x7f2cfb5e67a0>
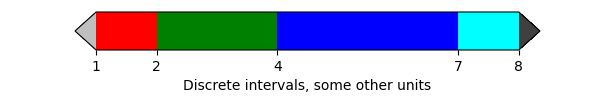
离散间隔颜色条#
第三个示例说明了
ListedColormap从一组列出的颜色生成颜色图的使用,colors.BoundaryNorm它根据离散间隔和扩展端生成颜色图索引以显示“上”和“下”值颜色。Over 和 under 用于显示规范化 [0, 1] 范围之外的数据。在这里,我们将颜色作为灰色阴影传递为编码 0-1 范围内的浮点数的字符串。
如果ListedColormap使用 a,则 bounds 数组的长度必须比颜色列表的长度大一。边界必须是单调递增的。
这次我们将额外的参数传递给
colorbar. 对于在不使用扩展关键字 with
的情况下在颜色条上显示的超出范围的值colors.BoundaryNorm,我们必须直接在颜色条调用中使用扩展关键字参数。在这里,我们还使用间距参数使每个颜色条段的长度与其对应的间隔成比例。
fig, ax = plt.subplots(figsize=(6, 1))
fig.subplots_adjust(bottom=0.5)

cmap = (mpl.colors.ListedColormap(['red', 'green', 'blue', 'cyan'])
        .with_extremes(over='0.25', under='0.75'))

bounds = [1, 2, 4, 7, 8]
norm = mpl.colors.BoundaryNorm(bounds, cmap.N)
fig.colorbar(
    mpl.cm.ScalarMappable(cmap=cmap, norm=norm),
    cax=ax,
    extend='both',
    ticks=bounds,
    spacing='proportional',
    orientation='horizontal',
    label='Discrete intervals, some other units',
)
<matplotlib.colorbar.Colorbar object at 0x7f2cdf4e8430>
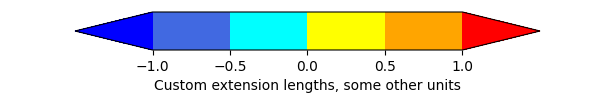
具有自定义扩展长度的颜色条#
在这里,我们说明了在具有离散间隔的颜色条上使用自定义长度颜色条扩展。要使每个扩展的长度与内部颜色的长度相同,请使用extendfrac='auto'.
fig, ax = plt.subplots(figsize=(6, 1))
fig.subplots_adjust(bottom=0.5)

cmap = (mpl.colors.ListedColormap(['royalblue', 'cyan', 'yellow', 'orange'])
        .with_extremes(over='red', under='blue'))

bounds = [-1.0, -0.5, 0.0, 0.5, 1.0]
norm = mpl.colors.BoundaryNorm(bounds, cmap.N)
fig.colorbar(
    mpl.cm.ScalarMappable(cmap=cmap, norm=norm),
    cax=ax,
    extend='both',
    extendfrac='auto',
    ticks=bounds,
    spacing='uniform',
    orientation='horizontal',
    label='Custom extension lengths, some other units',
)

plt.show()